
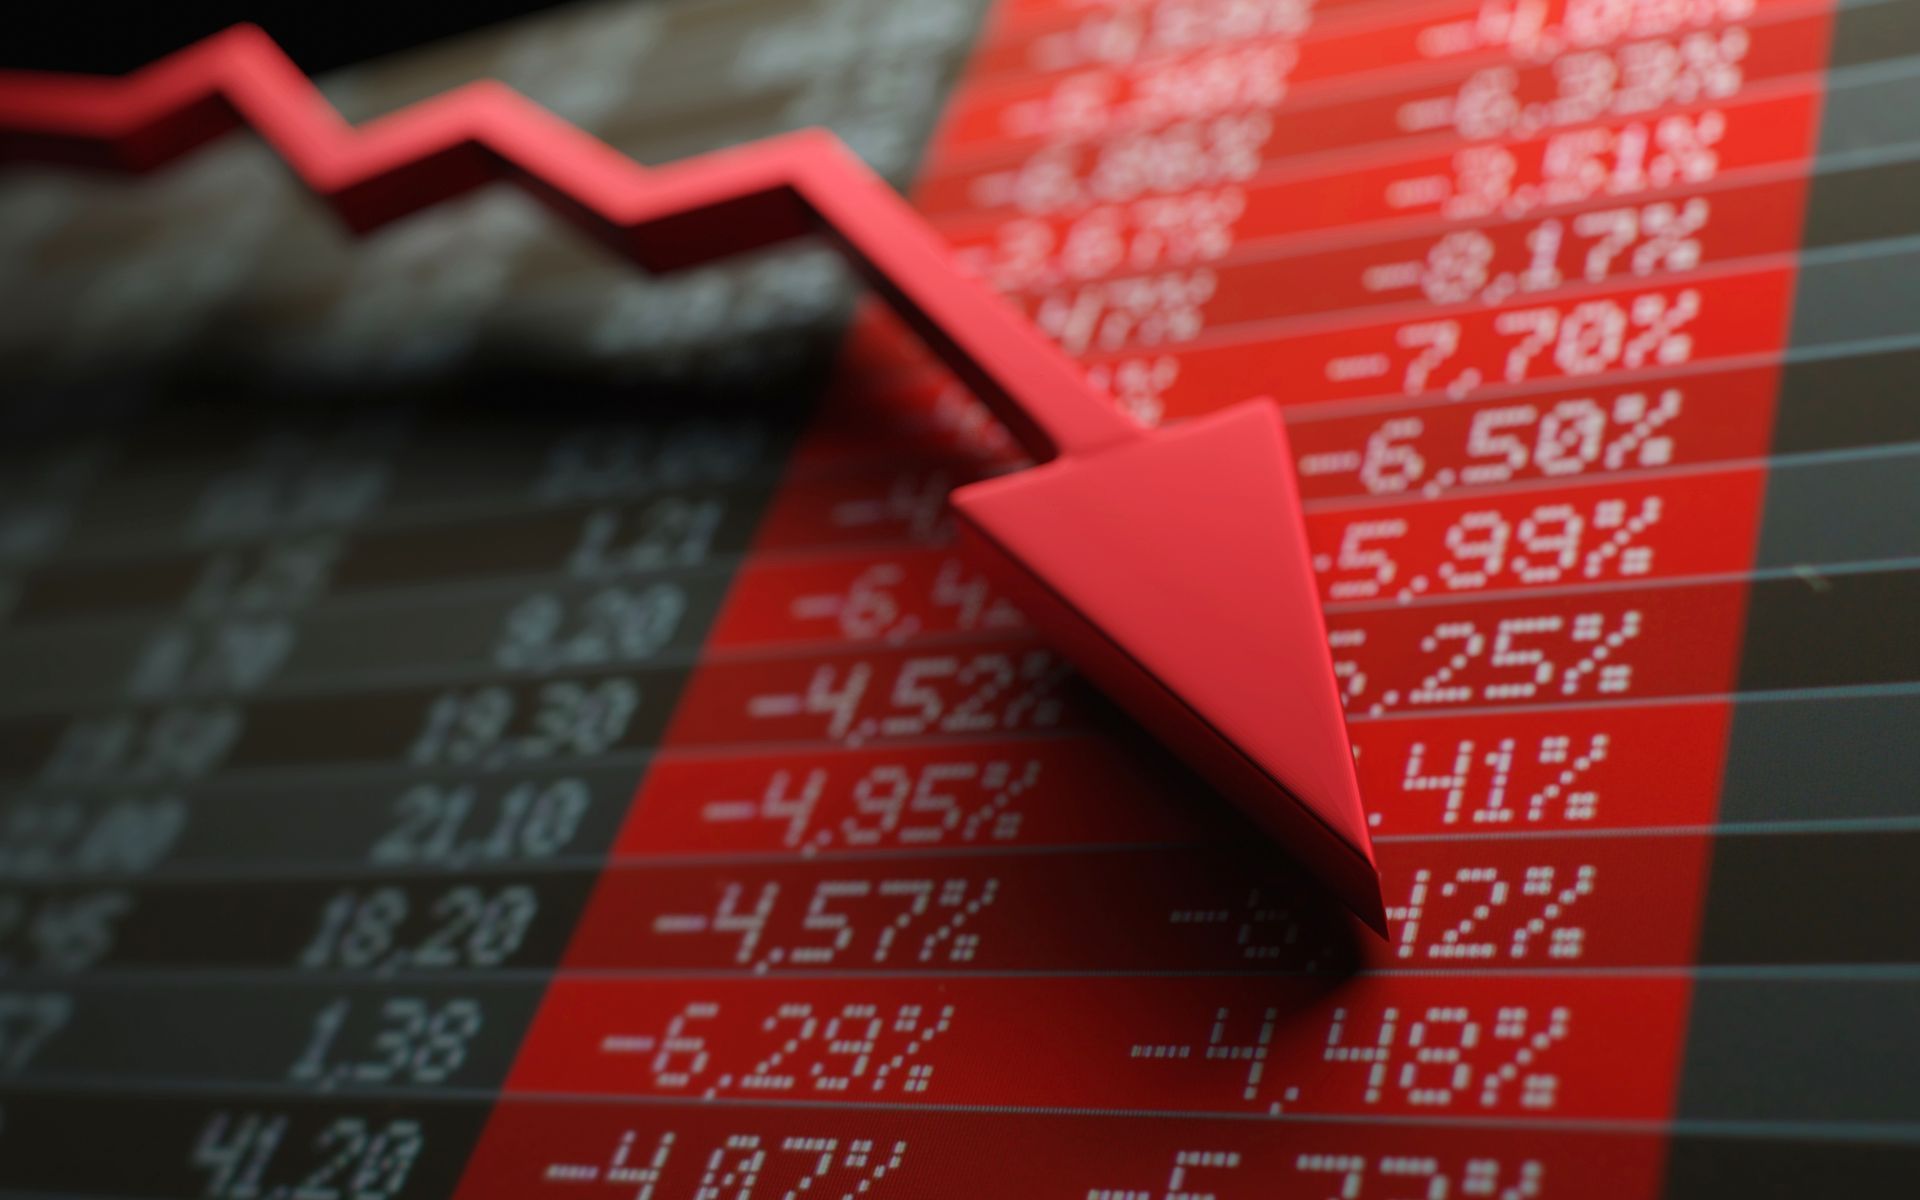
US Stock Market Dips Days Before Trump's New Tariffs Take Effect: What It Means for Precious Metals

Robert Kiyosaki's Bold Prediction: Silver is the Best Investment for Wealth Protection
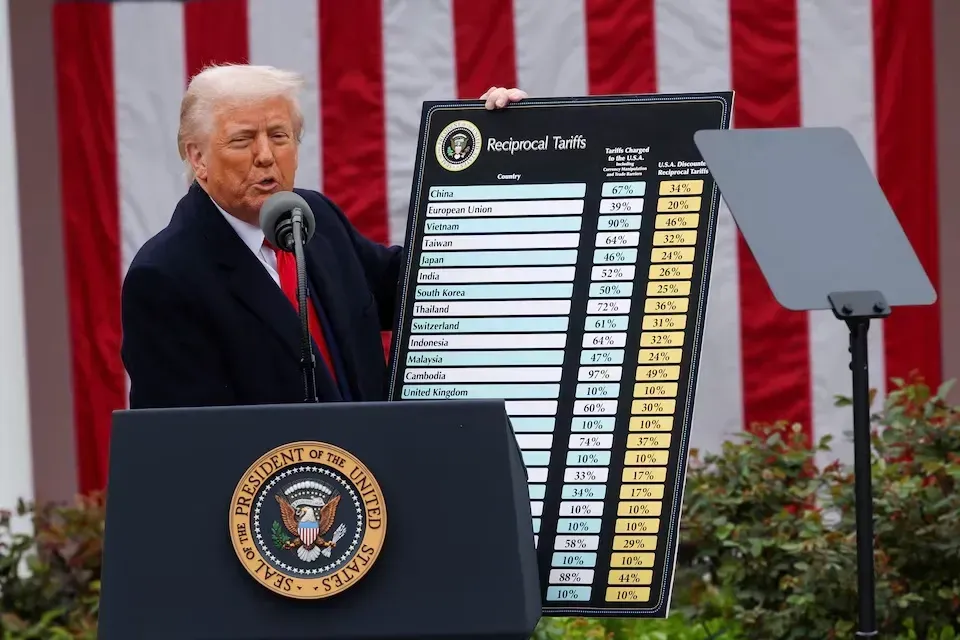
China, Japan, and South Korea Unite to Counter U.S. Tariffs: Implications for Precious Metals